《Excel》怎么创建组合图表、相信不少用户对此不是特别了解,分享吧小编就为大家带来excel2010创建组合图表方法介绍,一起来看看吧!
| Excel相关攻略合集 | ||||
| 怎么设置标题字体 | 2013输入带圈数字 | 2013清除表格数据格式 | 2013制作业绩趋势图 | 2016函数求梯形面积 |
| 2010制作切片器 | 2016数字万元显示 | 2016计算退休年龄 | 2013制作项目跟踪器 | 设置公式重算模式 |
方法步骤
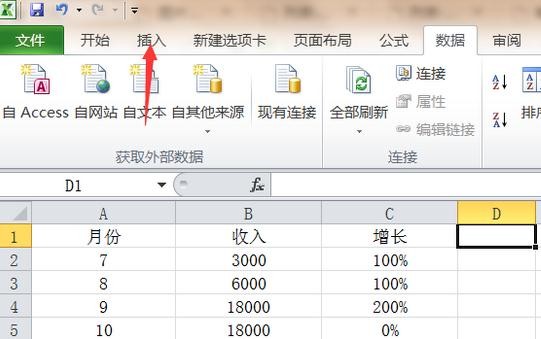
打开excel2010,点中一个空的单元格,点击“插入”。
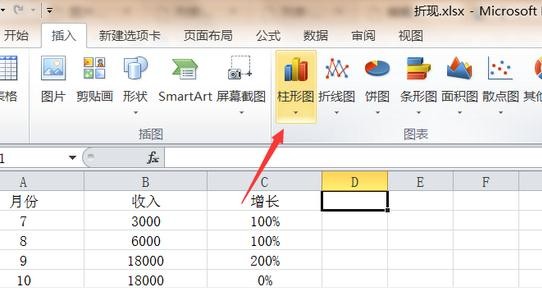
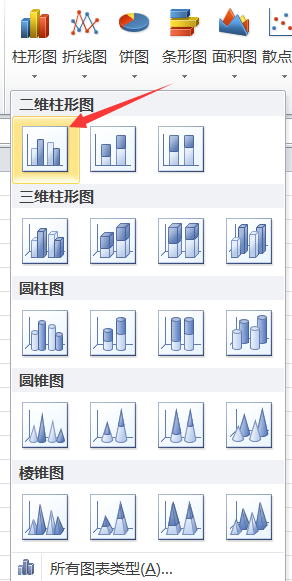
选择“柱形图”-“二维柱形图”。
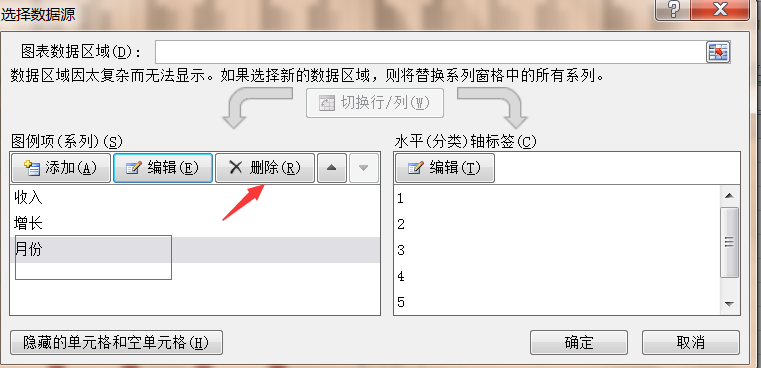
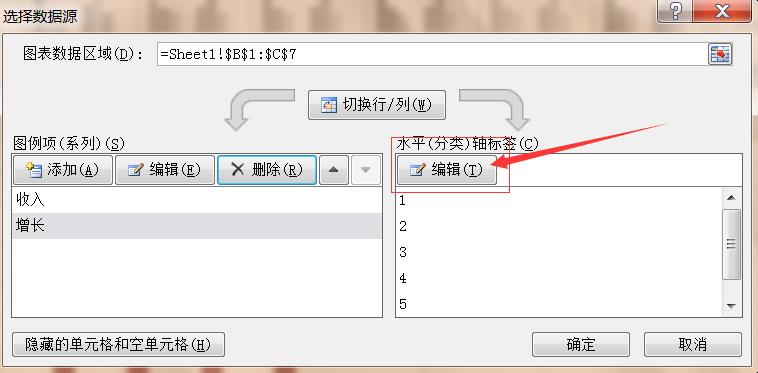
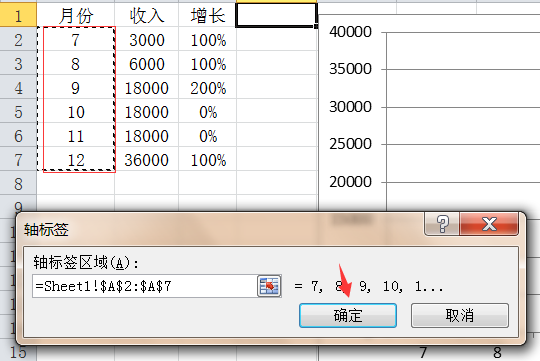
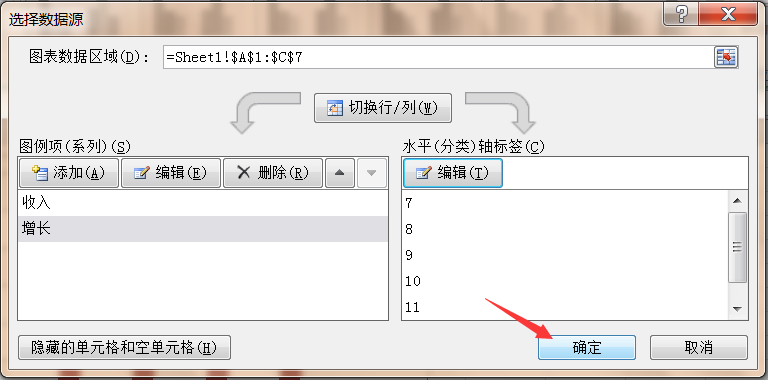
会出现柱形图。会发现出现的柱形图的数据对不上,这时你要“选择数据”。对坐标轴,系列等进行编辑:删除“月份”系列,接着为横坐标选中区域。如图。
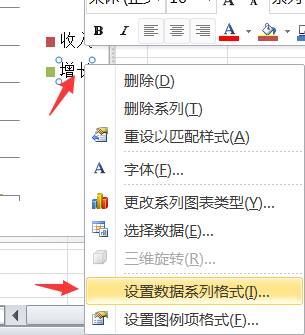
接着选定自己想设为折线图的系列,右键-“设置数据系列格式”。
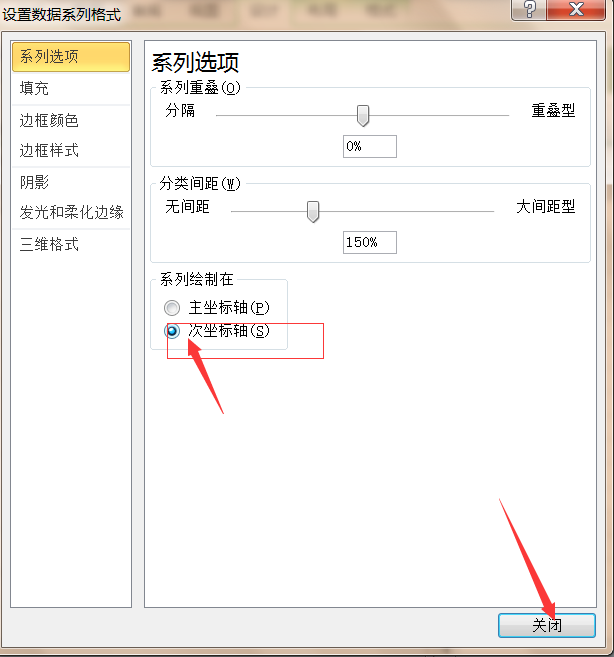
选择“次坐标轴”。
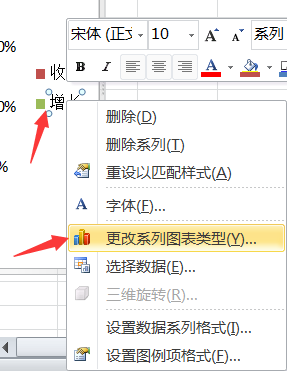
再选定你想设置为折线图的系列,右键-“更改系列图表类型”。
选择“折线图”。
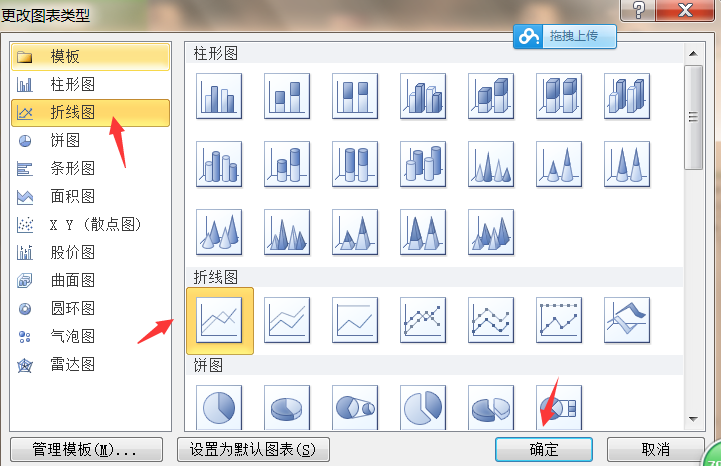
这样柱状图加折线图就做好了。
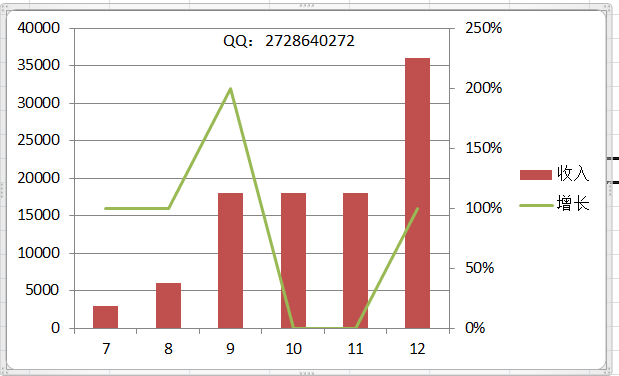
以上就是excel2010创建组合图表方法介绍,想了解更多《excel》教程,请关注分享吧下载站,每天为你带来最新消息!